Dashboard UI
The peekr dashboard is a real-time web interface for inspecting HTTP traffic flowing through the proxy. Launch it with:
Then open http://localhost:49997 in your browser (port can be customized with --ui-port).
Traffic Flow
Client Request
      |
      v
+------------------+       SSE: request event
|   peekr proxy    | --------------------------> [ Dashboard ]
+------------------+                              (browser)
      |
      v
  Upstream Server
Every request that passes through peekr is captured and streamed to the dashboard via Server-Sent Events (SSE). When you first open the dashboard, buffered requests are replayed so you immediately see recent traffic.
Layout Overview
The dashboard uses a 3-panel CSS Grid layout:
| Area | Position | Purpose |
|---|---|---|
| Top bar | Top | Filter controls and drawer toggles |
| Request table | Center | Scrollable list of captured requests |
| Detail drawer | Right | Headers, payload, and response inspection |
| Rules drawer | Left | Active rules list and rule creation form |
| Breakpoints panel | Right overlay | Pending breakpoints awaiting manual resume |
| Log drawer | Bottom | Child process stdout/stderr output |
Top Bar Filters
The top bar provides several controls to narrow down displayed traffic:
- Method -- Dropdown to filter by HTTP method (GET, POST, PUT, DELETE, etc.).
- Direction -- Toggle between IN (incoming via reverse proxy) and OUT (outgoing intercepted calls).
- Status -- Dropdown to filter by response status code range (2xx, 3xx, 4xx, 5xx).
- Host -- Dropdown populated from captured traffic to filter by hostname.
- Search -- Free-text input that matches against host and path.
Filters combine with AND logic — only requests matching all active filters are shown.
Drawer Toggles
Icon buttons on the right side of the top bar control drawer visibility:
| Icon | Drawer |
|---|---|
| ⚙ (Gear) | Rules drawer (left) |
| ☰ (Hamburger) | Log drawer (bottom) |
| ▶ (Play) | Detail drawer (right) |
| ▮ (Pause) | Breakpoints panel |
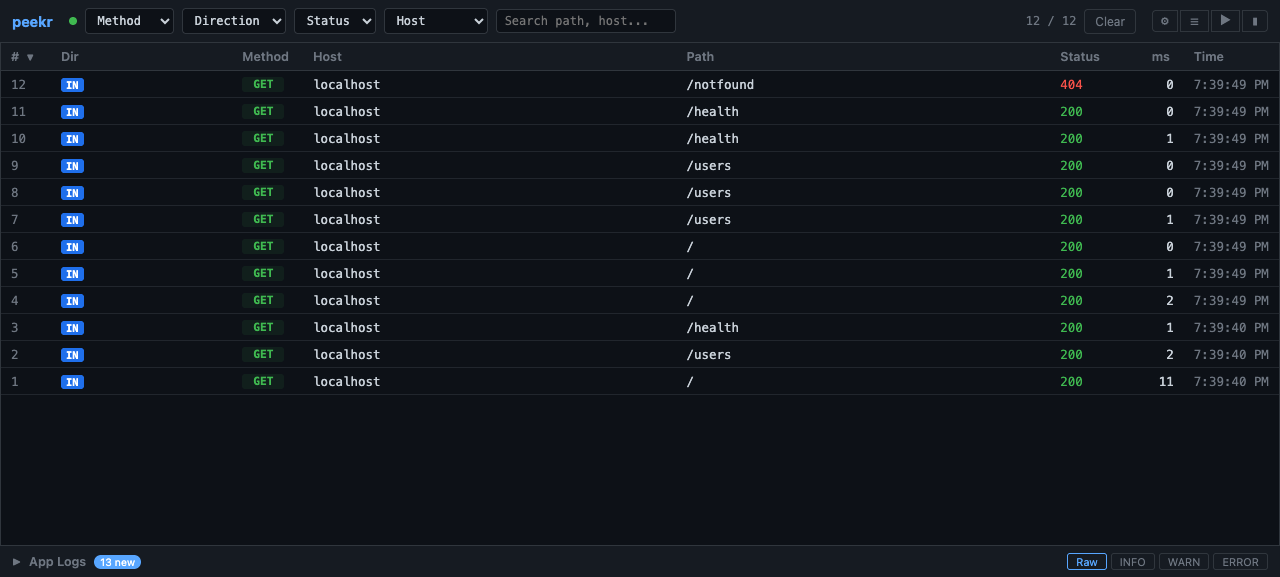
Request Table
The main area displays a table of captured requests with the following columns:
| Column | Description |
|---|---|
| # | Sequential request number |
| Dir | IN or OUT badge |
| Method | HTTP method (GET, POST, etc.) |
| Host | Target hostname |
| Path | Request path |
| Status | HTTP response status code |
| ms | Round-trip time in milliseconds |
| Time | Wall-clock time of the request |
Sorting -- Click any column header to sort by that column. Click again to reverse the sort order.
Selecting -- Click a row to open the detail drawer with full request/response information.
Rule Match Badges
Some rows display colored badges indicating rule matches:
- BLK (red) -- The request matched a block rule and was rejected with a
403response. - MOD (blue) -- The request matched a modify rule; headers or body were mutated.
- BP (yellow) -- The request matched a breakpoint rule and was paused for inspection.
Detail Drawer
Click any request row to open the right-side detail drawer. It has three size states, cycled by clicking the toggle button (▶):
- Collapsed -- Hidden.
- Medium -- Approximately 40% of the viewport width.
- Expanded -- Approximately 65% of the viewport width.
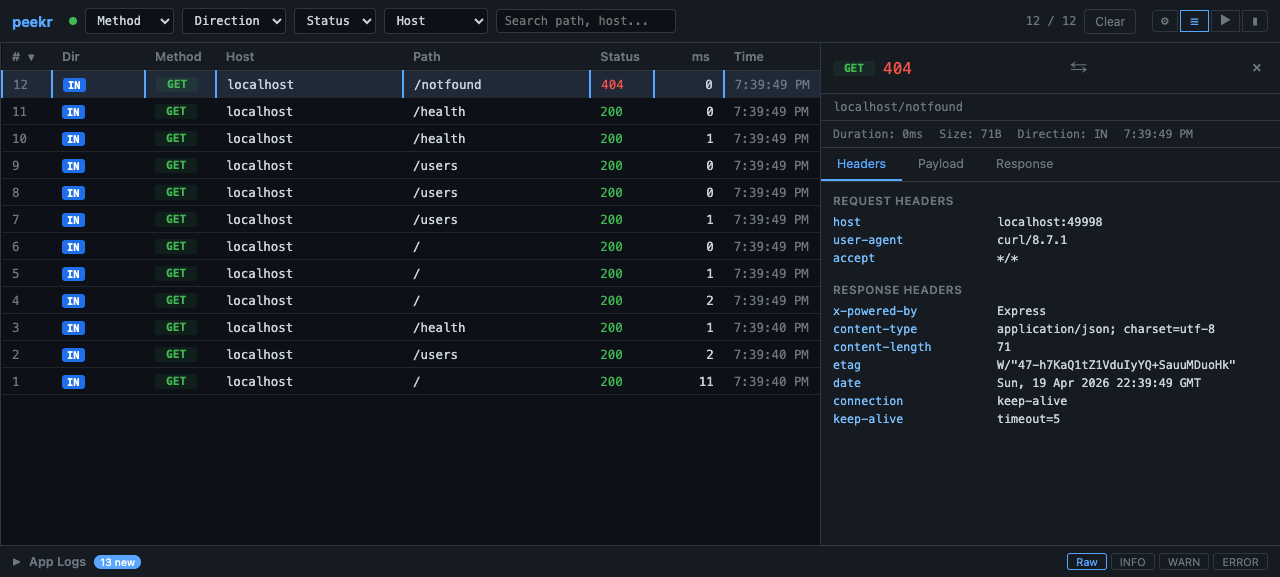
Tabs
| Tab | Content |
|---|---|
| Headers | Request and response headers displayed as key-value pairs |
| Payload | Request body (form data, JSON, etc.) |
| Response | Response body with JSON syntax highlighting |
JSON bodies are automatically syntax-highlighted using CSS-only regex tokenization — no external libraries required.
Breakpoints Panel
When a breakpoint rule is active and a matching request arrives, it is paused and appears in the breakpoints panel. Open it with the ▮ button in the top bar.
Each pending breakpoint shows:
- The request method, host, path, and phase (request or response)
- Full headers and body at the pause point
- Resume button — forwards the request (with any edits applied)
- Abort button — cancels the request with a 503 response
Breakpoints are resolved via POST /api/breakpoints/:id/resolve. See the Rules Engine guide for the API details.
Log Drawer
The bottom drawer shows stdout and stderr output from child processes managed by peekr. It has three fixed height states:
- Collapsed -- Thin bar, no content visible.
- Medium -- Approximately 200px tall.
- Expanded -- Approximately 400px tall.
Log Level Filtering
Four filter buttons control which log lines are displayed:
| Button | Shows |
|---|---|
| Raw | All raw output (unfiltered) |
| INFO | Informational messages only |
| WARN | Warnings only |
| ERROR | Errors only |
ANSI escape codes are automatically stripped before filtering and display.
Context Menu
Right-click any request row to open a context menu with options:
- Block this host -- Creates a block rule for the request's host. Future requests to that host will receive a
403 Forbiddenresponse. - Modify this host -- Creates a modify rule for the request's host. Opens the rules drawer to configure request/response mutations.
Both actions create rules via POST /api/rules. See the Rules Engine guide for details on how rules work.
Rules Drawer
Click the ⚙ gear icon to open the rules drawer on the left side. The drawer shows all active rules and a form to create new ones.
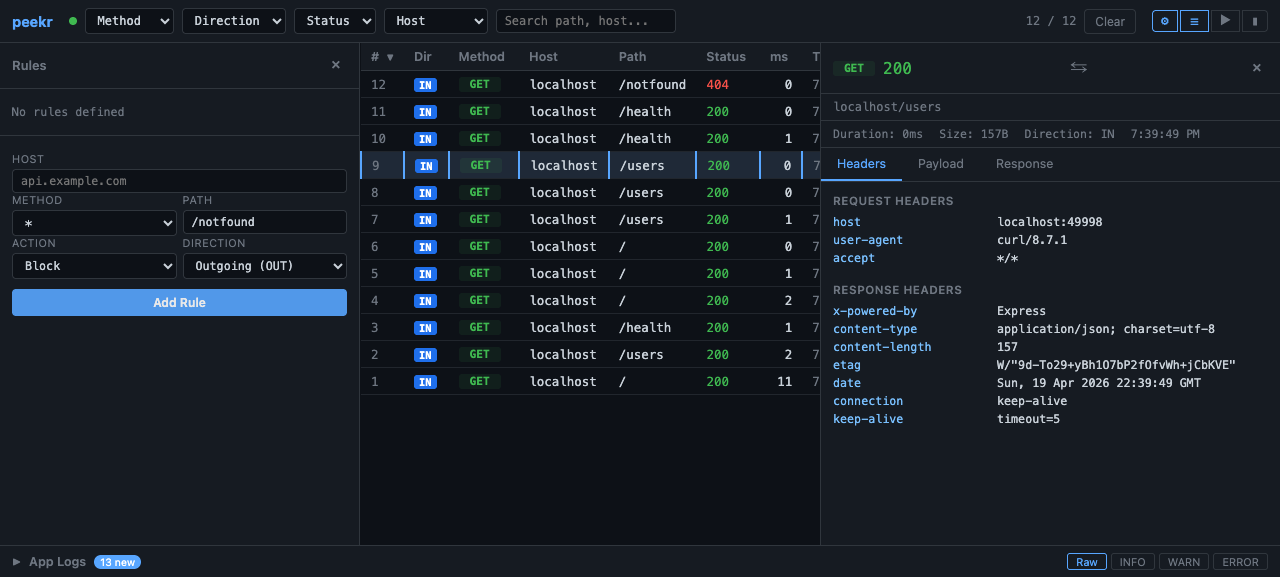
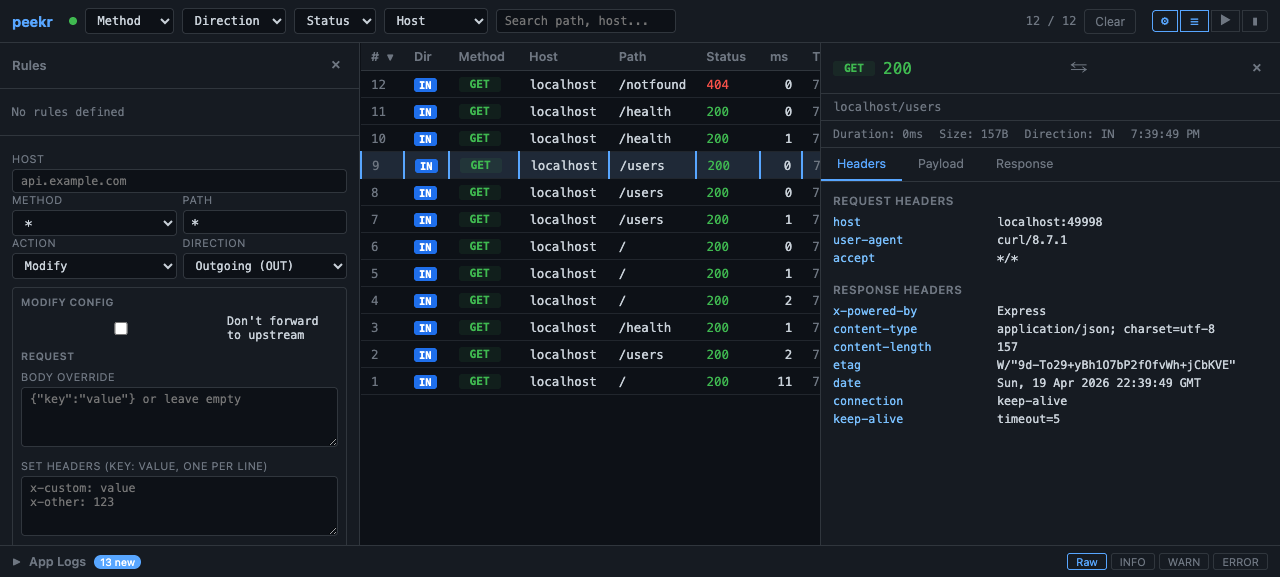
Rule Form
The form accepts:
- Host — hostname to match (pre-filled from context menu)
- Method — HTTP method or * for all
- Path — path prefix
- Direction — Incoming (IN), Outgoing (OUT), or both
- Action — Block, Modify, or Breakpoint
- For Modify: request/response body and header fields
- For Breakpoint: phase selector (request / response / both)
Real-Time Updates
The dashboard maintains an SSE connection to the proxy server. Named event types keep the UI in sync:
| Event | Purpose |
|---|---|
request |
New request captured — adds a row to the table |
app-log |
Child process log output — appends to the log drawer |
rules-change |
Rule created or deleted — refreshes the rules drawer |
breakpoint |
New breakpoint paused — adds to the breakpoints panel |
If the connection drops, the dashboard reconnects automatically. On reconnect, buffered events are replayed to fill any gaps.